Skip to content

Solutions & Action Center

From observation to action

Connect what the satellite record shows with the interventions reef managers use, test simple what-if scenarios, and build a plan you can share. Everything here is exploratory and clearly labelled.
Selected reef
Lizard Island · Northern Great Barrier Reef, Australia
Analysis period
Full record
Latest satellite months
SST Mar 2026 · Chl-a Apr 2026

Signals from Lizard Island

Satellite data can point to two of the four pressures commonly managed on reefs. The other two need eyes in the water.

Observation
Signal present

Heat stress

Unusually warm water during the warm season.

Trend +0.37 °C per decade. Months above the warmest-month average went from 1.3 to 2.3 per year. Latest 12 months +0.83 °C.

No clear signal

Water quality

Runoff, nutrients and sediment reaching reef waters.

Chlorophyll-a trend +2.0% per decade (range includes zero). Last five years +4% vs baseline.

Not visible from space

Physical damage

Anchors, groundings, trampling and coastal works.

Anchor damage, groundings and coastal works can only be tracked through site visits, development records or local knowledge.

Not visible from space

Ecological balance

Fishing pressure, predator outbreaks and recovery.

Fish populations, predator outbreaks and coral recovery need in-water surveys.
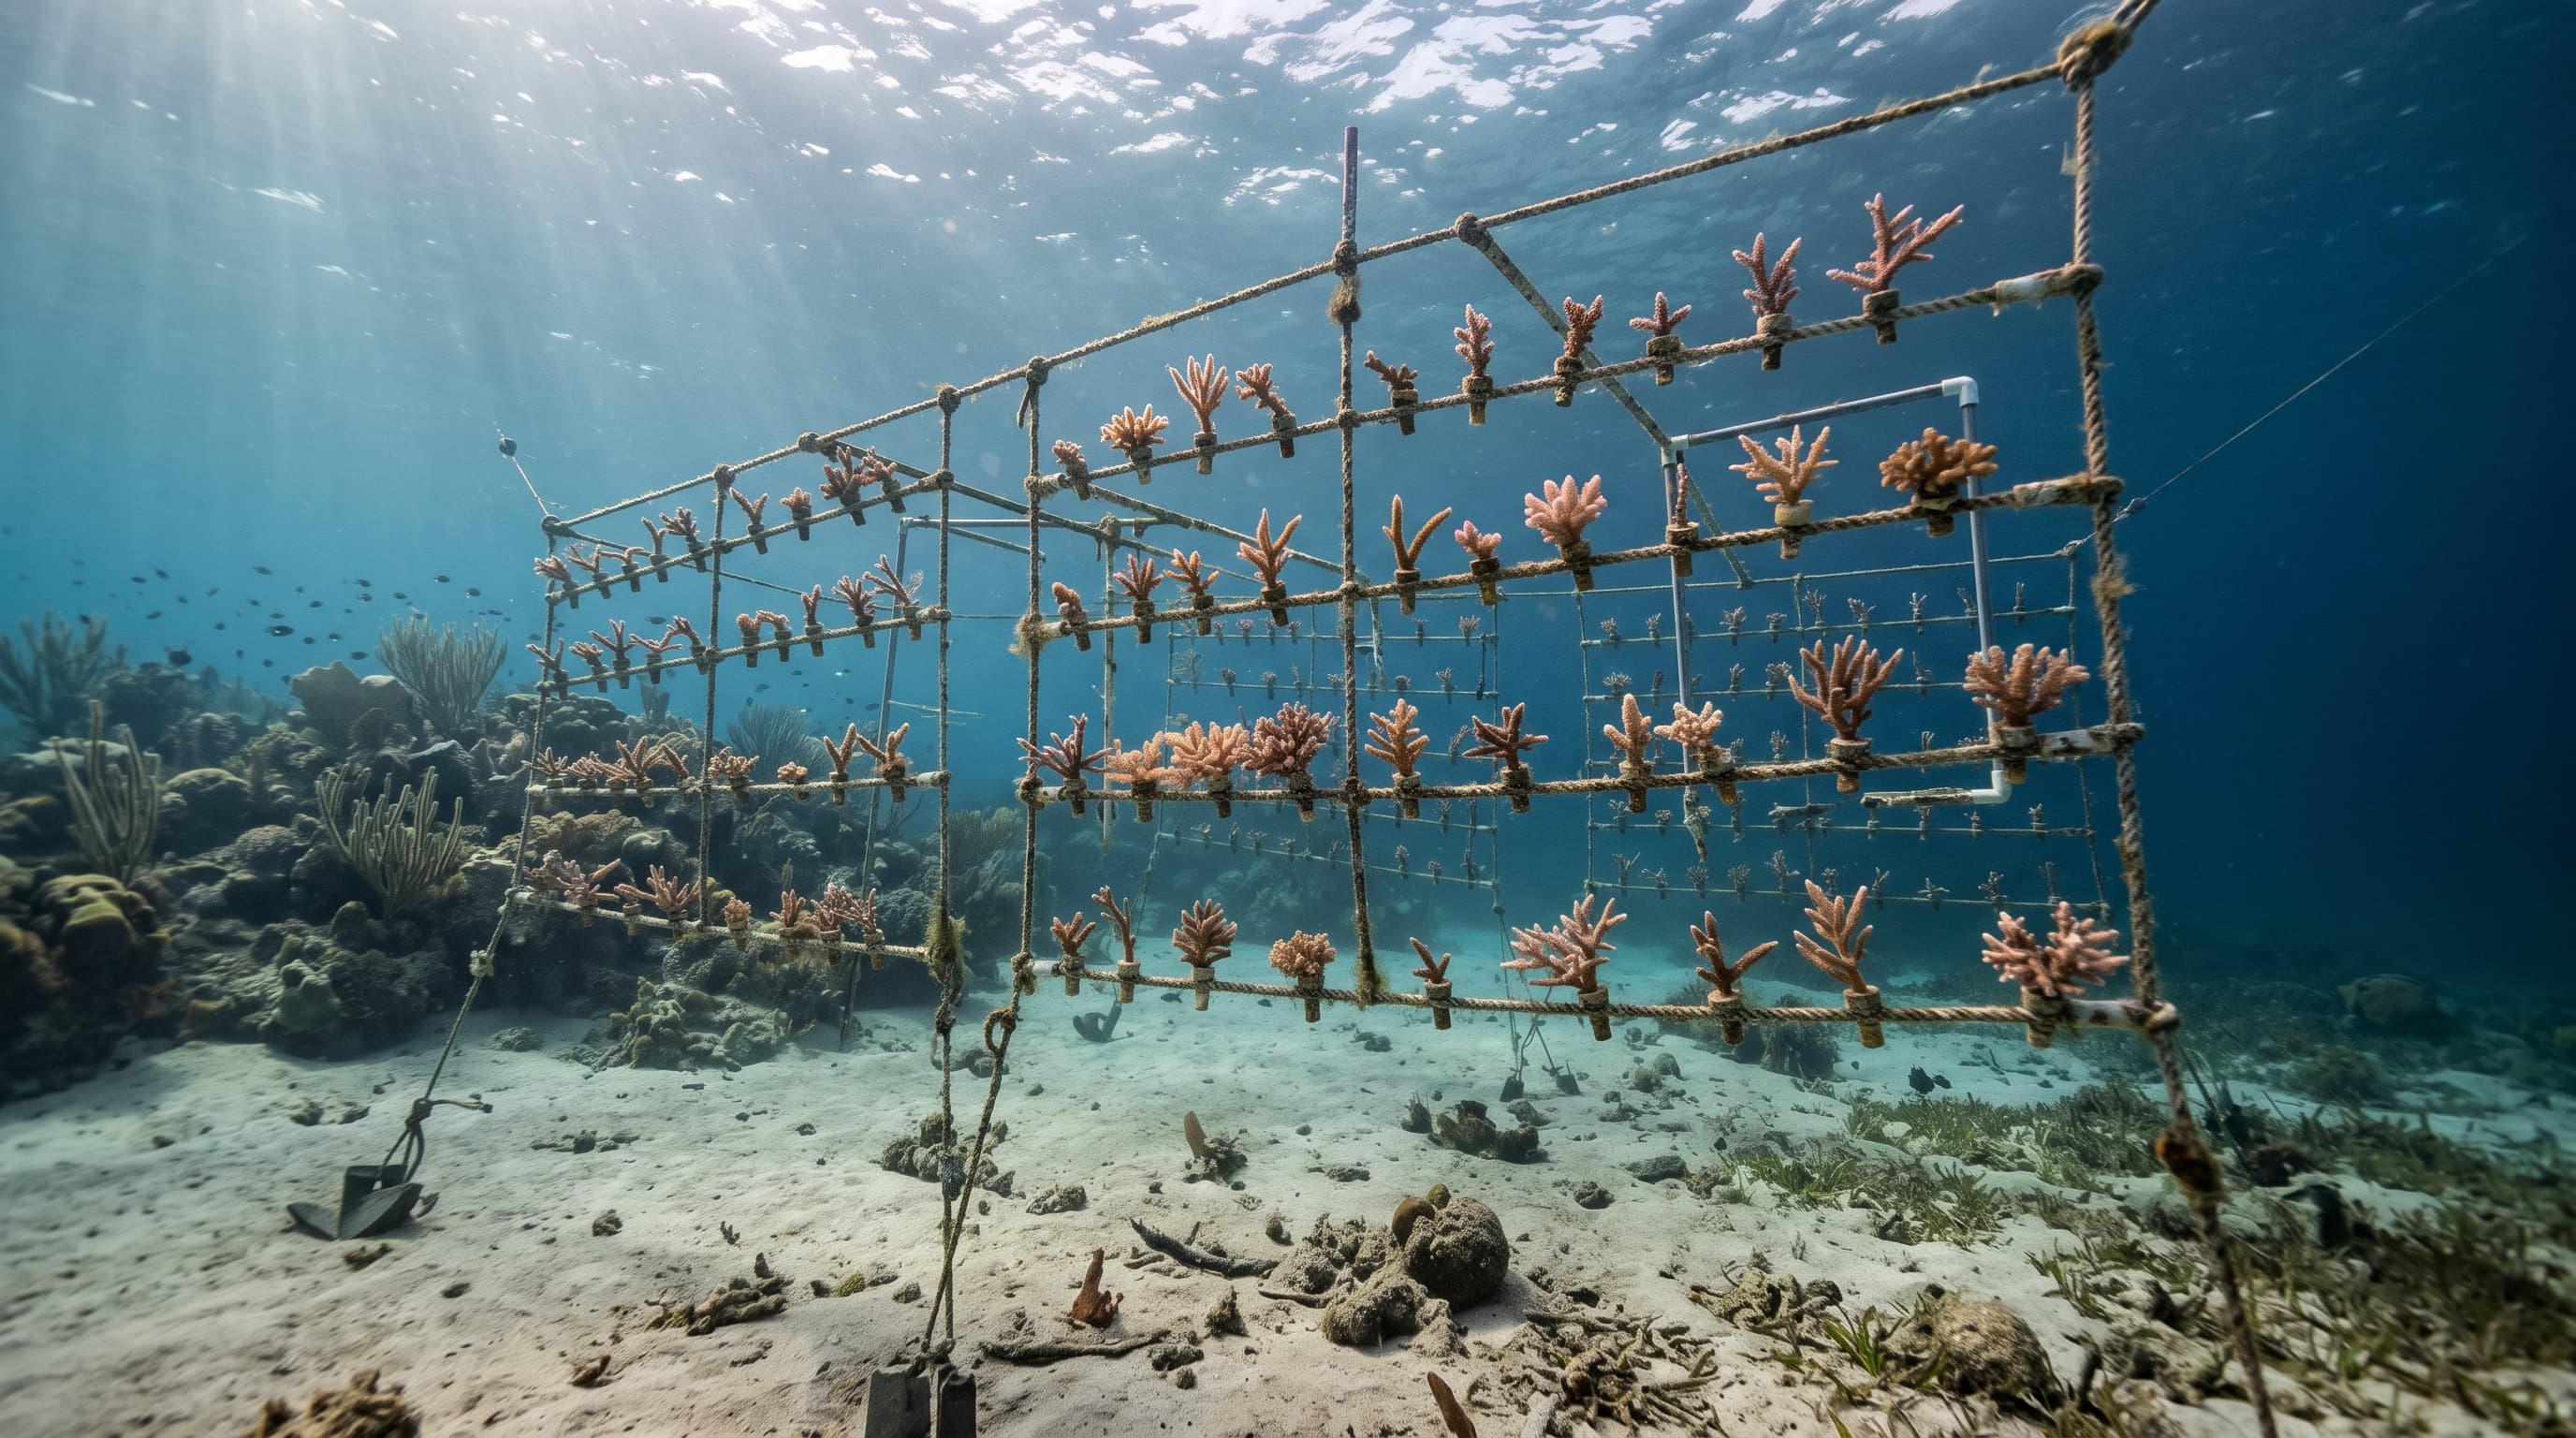
Young coral fragments growing on lines in an underwater nursery
Interpretation

Local action buys time. The heat itself is a global problem.

Cleaner water, protection and restoration can help reefs cope and recover. None of them lowers ocean temperature, which is why most reef scientists pair local management with cutting the emissions that drive warming.

Hypothetical

What if the water were warmer?

Add a uniform amount of warming to Lizard Island's 2003–2012 seasonal cycle and see how many months would sit above its warmest-month average. It is simple arithmetic on observed averages, not a forecast of future temperatures or of how corals would respond.

  • 2003–2012 average
  • With hypothetical warming
  • Warmest-month average
0 °C+1 °C+2 °C
Months above the warmest-month average
4 / 12
Months at least 1 °C above it
1 / 12

Months that would pass the threshold: Jan, Feb, Mar, Dec.

If the observed trend of +0.37 °C per decade simply continued, a shift of +1.0 °C from the baseline average would take roughly 27 years. Real warming is uneven and depends on future emissions, so treat this as a sense of scale only.

Intervention library

Twelve approaches used or trialled on reefs worldwide. Each card says which pressure it addresses, how mature the evidence is, and what ReefLine's data can and cannot tell you about it.

Showing 12 of 12 interventions

Cut greenhouse gas emissions

Slowing ocean warming at its source by reducing the emissions that drive it.

Heat stressGlobalDecades
Established· Widely used, with a substantial evidence base.
What ReefLine adds
Warming trends in ReefLine are consistent with broad ocean warming, which local action alone cannot reverse.
Limits
Benefits arrive over decades and depend on action far beyond any single reef.

Heat-stress early warning and response plans

Using satellite temperature monitoring to prepare surveys and protective measures before and during warm periods.

Heat stressRegion or catchmentWeeks to months
Established· Widely used, with a substantial evidence base.
What ReefLine adds
The warm-season timing and months above the warmest-month average show when a response plan would matter most.
Limits
Warnings do not cool the water. They help managers time monitoring and reduce other stresses.

Marine protected areas and no-take zones

Limiting fishing and damaging activities so reef communities face fewer pressures at once.

Ecological balancePhysical damageRegion or catchmentYears
Established· Widely used, with a substantial evidence base.
What ReefLine adds
Satellites cannot see fish or coral, but a reef that experiences repeated warm periods may benefit from fewer additional stresses.
Limits
Protection does not prevent marine heatwaves or bleaching.

Reduce runoff and nutrient pollution

Managing land use, fertiliser and erosion in catchments that drain towards the reef.

Water qualityRegion or catchmentYears to decades
Established· Widely used, with a substantial evidence base.
What ReefLine adds
Months with unusually high chlorophyll-a can flag where water-quality sampling might be worthwhile.
Limits
Chlorophyll-a alone cannot identify a pollution source or show that runoff reaches the reef.

Improve wastewater treatment

Treating sewage and stormwater before it reaches coastal water.

Water qualityLocal reefYears
Established· Widely used, with a substantial evidence base.
What ReefLine adds
Persistent chlorophyll-a increases near populated coasts are one reason to investigate local discharges.
Limits
Most relevant where reefs sit close to towns, resorts or ports.

Protect herbivorous fish

Keeping parrotfish and other grazers abundant so algae do not overgrow recovering coral.

Ecological balanceLocal reefYears
Developing· In use at growing scale, with evidence still building.
What ReefLine adds
Not visible from satellite data. Pairs with in-water surveys of fish and algae.
Limits
Benefits depend on local fishing patterns and enforcement.

Mooring buoys and visitor management

Replacing anchoring with fixed moorings and guiding divers, snorkellers and boats.

Physical damageLocal reefMonths
Established· Widely used, with a substantial evidence base.
What ReefLine adds
Not visible from satellite data. Best paired with site visits and visitor counts.
Limits
Addresses physical damage only.

Crown-of-thorns starfish control

Removing coral-eating starfish during outbreaks on Indo-Pacific reefs.

Ecological balanceLocal reefMonths to years
Established· Widely used, with a substantial evidence base.
What ReefLine adds
Not visible from satellite data. Outbreak monitoring relies on in-water surveys.
Limits
Only relevant where the starfish occur, and needs sustained effort.

Coral gardening and outplanting

Growing coral fragments in nurseries and planting them back onto damaged reef.

Ecological balanceLocal reefYears
Developing· In use at growing scale, with evidence still building.
What ReefLine adds
Temperature records help choose sites and timing that avoid the warmest months.
Limits
Costly per hectare and exposed to the same heat that damaged the reef in the first place.

Larval reseeding

Collecting coral spawn, rearing larvae and settling them on degraded reef.

Ecological balanceLocal reefYears
Experimental· Early trials, with open questions about scale and side effects.
What ReefLine adds
Seasonal temperature patterns can inform when and where settlement is attempted.
Limits
Still being scaled up, and results vary between sites.

Heat-tolerant corals

Breeding or selecting corals that cope better with warm water, sometimes called assisted evolution.

Heat stressLocal reefYears to decades
Experimental· Early trials, with open questions about scale and side effects.
What ReefLine adds
Each reef's warmest-month average and warming trend describe the conditions such corals would need to tolerate.
Limits
Experimental, with open questions about ecological trade-offs and scale.

Local cooling and shading

Reducing light or heat over small, high-value reef areas during heat events.

Heat stressLocal reefWeeks
Experimental· Early trials, with open questions about scale and side effects.
What ReefLine adds
Warm-season timing indicates when such measures would have to be in place.
Limits
Only feasible over very small areas so far.

Pair satellite trends with in-water monitoring

The strongest decisions combine long satellite records with surveys of coral cover, bleaching, fish and water quality on the reef itself. Start with the methods behind ReefLine's numbers.