Sea-surface temperature
Latest available monthly composite
28.63°C
−0.09 °Cvs the 2003–2012 March average
Apr 2023Last 36 monthsMar 2026
- Pixel coverage that month
- 100% (64 pixels)
- Last 12 months vs baseline
- +0.83 °C
Coral reef environmental intelligence
ReefLine transforms satellite-derived ocean observations into accessible environmental insights, helping you explore changing conditions across coral reef ecosystems.
Browse all 11 reefs on the mapSelected reef
Northern Great Barrier Reef, Australia
Coral Sea, Pacific Ocean
A granite island on the northern Great Barrier Reef and home of the Lizard Island Research Station, operated by the Australian Museum.
Each sliver is one month, brighter when more pixels were clear.
Jan 2003 – Mar 2026 · no composite for Dec 2024, Dec 2025
Jul 2002 – Apr 2026 · no composite for Jan 2024, Nov 2024, Dec 2024, Oct 2025, Nov 2025, Dec 2025
Trends and comparisons use this window.
Jul 2002 – Apr 2026
23 yr 10 mo of monthly composites
Latest available monthly composite
28.63°C
−0.09 °Cvs the 2003–2012 March average
Latest available monthly composite
0.429mg/m³
+13%vs the 2003–2012 April average
Linear trend of monthly anomalies across the analysis period
+0.37°C per decade
95% range +0.21 to +0.54. The range excludes zero.
Jan 2003 – Mar 2026
+2.0%% per decade
95% range −2.5% to +6.8%. The range includes zero, so no clear trend.
Jul 2002 – Apr 2026
Values are the newest monthly satellite composites in ReefLine's dataset, not live readings. Composites are published after the month ends, so the latest available month can be several months old.
Reef network
How to read ReefLine
Satellite measurements describe the water around a reef. They cannot see coral health, confirm bleaching or predict outcomes. So every statement in ReefLine carries one of four labels, and the examples here are written for Lizard Island.
Directly calculated from the satellite record.
The mean sea-surface temperature across the Lizard Island analysis area in March 2026 was 28.63 °C.
What a pattern may mean, with its uncertainty stated.
A rising temperature trend means warm months occur more often than in the early-2000s baseline. On its own, it does not show how the corals themselves responded.
A possible explanation that needs further investigation.
Chlorophyll-a at Lizard Island usually peaks in March. Seasonal mixing, runoff or plankton blooms could explain this, and in-water sampling would be needed to tell them apart.
A what-if illustration, not a forecast.
If every month were 1 °C warmer than its 2003–2012 average, 4 of 12 months would sit above this reef's warmest-month average. This is arithmetic, not a forecast.
Keep exploring
Find all eleven reefs on an ocean map, inspect the 4 km satellite pixels behind each average and compare up to four reefs side by side.
Open the mapRead sea-surface temperature and chlorophyll-a month by month, as anomalies or yearly averages, with trends, seasonal cycles and heat maps.
Analyse trendsRecords, unusual months and cross-reef patterns, each labelled as an observation, interpretation or hypothesis.
Read insights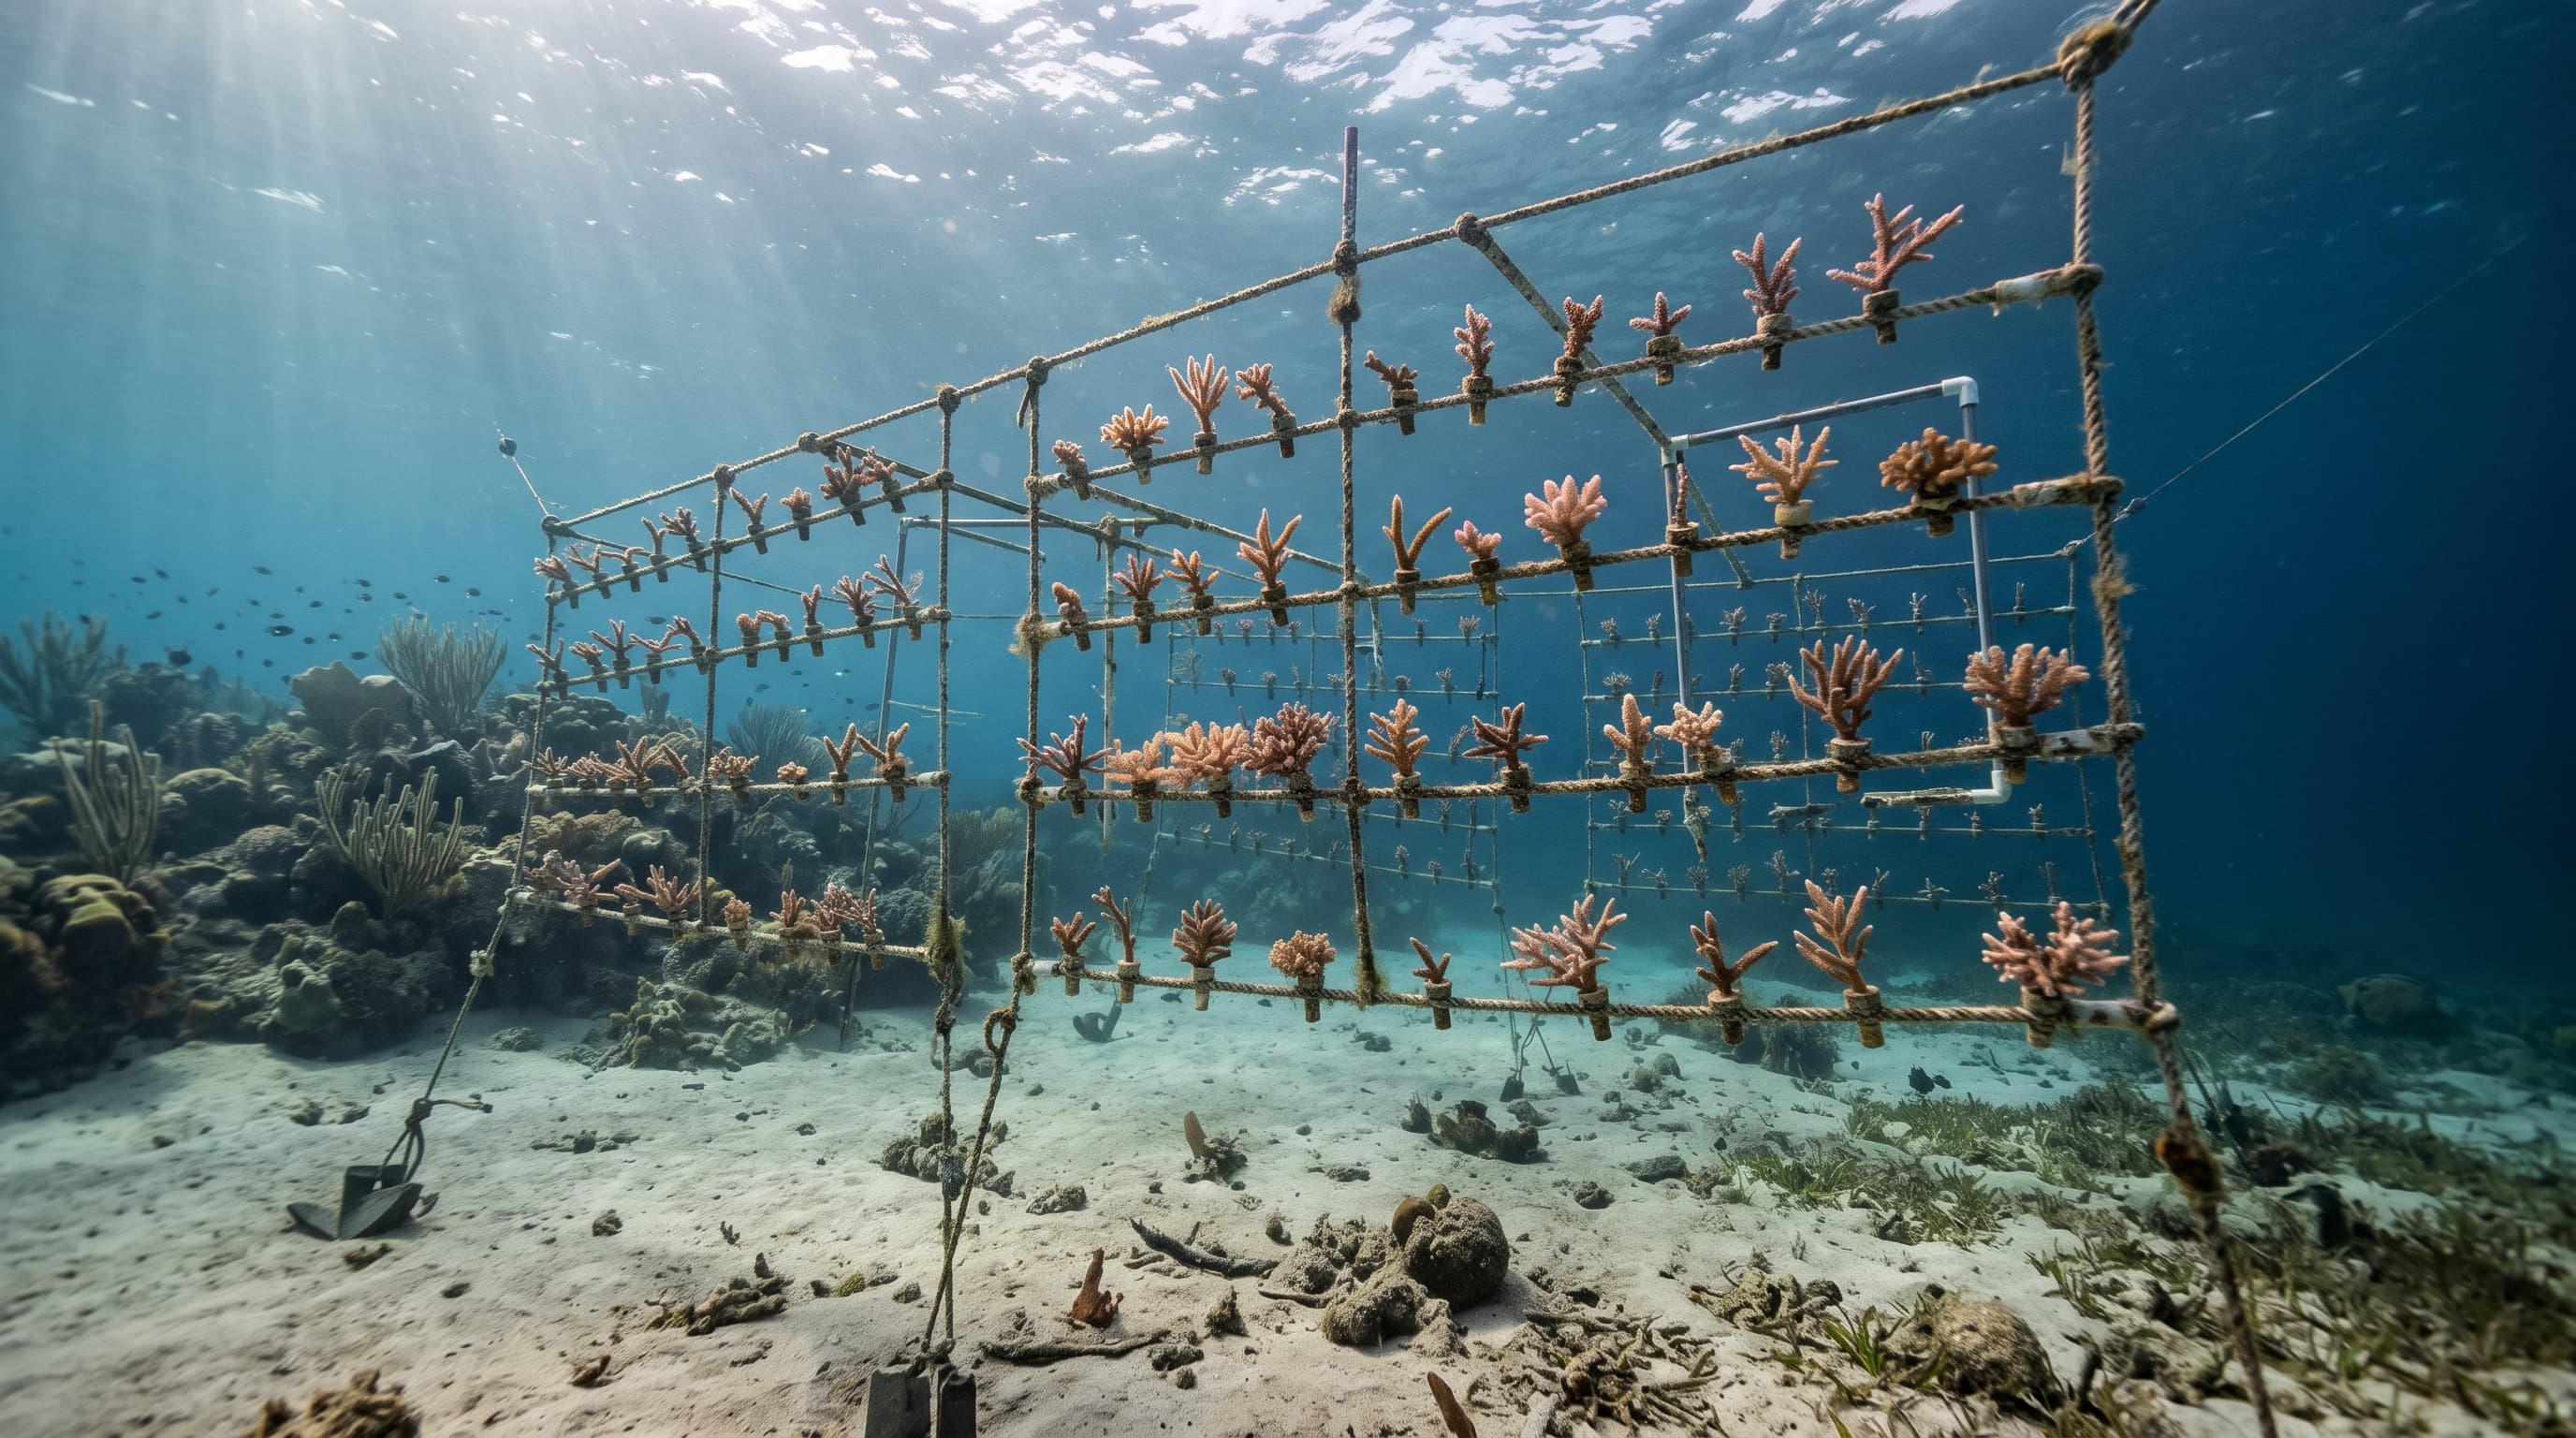
Explore conservation interventions, what each one can and cannot address, and simple what-if warming scenarios.
Plan actionsWhere the data comes from, how ReefLine processes it, how much is missing and what it cannot tell you.
See the method